.png?width=1306&name=dashboard%20v1%20(edit).png)
What are Records Analytics?
Records analytics are graphical overviews of your organization's records management system. They provide insights by distinguishing aspects of records, such as categorization, type, and areas for improvement. This article will cover:
- The Benefits of Records Analytics
- How to Apply 6 Records Analytics Features, including:
We've provided a short video demonstrating how these features can be put to use for supporting your organization's IT department. You can also check out our article on content analytics, and their value for records management.
The Benefits of Records Analytics
Managing records is an iterative process that takes careful planning and organization to execute well. In an institution creating hundreds or thousands of documents every week, record analytics features will provide a visualization of how that landscape of records is evolving.
For an organization's records manager, records analytics are perfect for getting a high-level understanding of how your company organizes its documents in one glance.
Records analytics features empower all users by providing a unique overview of how much content is categorized or preserved in different record categories, record states, and record types. Record categories, for example, help ensure documents follow compliance regulations.
6 Records Analytics Features
Using a cloud-based solution like Collabspace CONTINUUM allows organizations to apply these features for their intended insights and benefits. We’ll cover six types of records analytics available in Collabspace (shown in the screenshot at the top of this article) and show how they can be applied.*
1. Categorized versus Uncategorized
The Categorized vs Uncategorized card displays all content in an organization's Collabspace by whether it is categorized or not. This chart paints a picture of how well your records management strategy plays out, as uncategorized content should reduce over time. It is valuable to ensure records management compliance, as items that are not categorized cannot follow correct compliance procedures.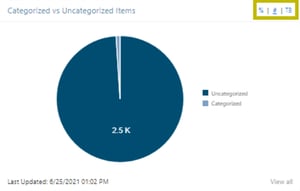
A record is categorized if it resides within a record category under any file plan from the Compliance app. We can change the view between percentages, item count, or volume by clicking on either %, #, or TB within the yellow outline.
The shown chart identifies that the majority of content is not categorized and thus has no retention policy, which risks the items not following proper compliance procedures.
2. Content by Record Category
How is content stored across various record categories? It's impossible to answer this question solely from search results. The Content by Record Categories dashboard card shows the division of an organization's Collabspace content across record categories.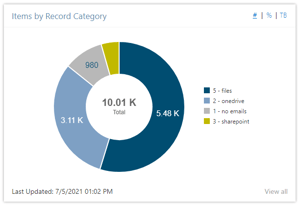
In the Categories card, we can understand which departments generate the most records from a single glance. To change views, click on one of %, #, or TB to alternate between percentage, item count, and volume.
This graph can show the proportion of content categorized under the top eight record categories with the most content. All other categorized content is under "Other,." In the case of the screenshot shown to the right, there are only four organizational record categories, thus there is no "Other."
The Categories card can help record managers identify discrepancies from the organizational policies. For example, transitory content is temporary by definition. Say that your organization has a policy for transitory files to be reviewed and destroyed after three months. If the proportion of transitory files is steadily increasing over time, it's clear that the intended outcome is not being reached consistently. Seeing discrepancies like these allows organizations to pivot and improve how they manage their records.
3. Record versus Non-Record
The Preserve action marks the content's Record State as Active in its respective workflow. If a record is active, it conveys that the content is of value to the organization and will remain in Collabspace when deleted at the source. To represent this at a high level, the Record versus Non-Record dashboard card displays documents partitioned by whether or not they are active records.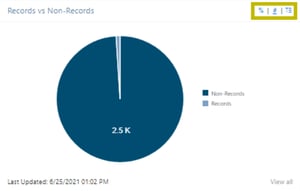
This gives records managers an overview of how much content is being preserved. Non-Active records include items that require review, uncategorized content, retained content, or destroyed content. Again, users can change this graph's view between percentage, item count, and volume by selecting %, #, or TB.
4. Records by File Type
Breaking up records by file type is an insightful tool because the file type is a distinguishing feature of documents. Viewing which file types are the most prominent among active records can help identify storage needs and understand business requirements.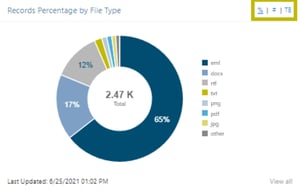
The File Type dashboard card displays a doughnut chart of the total volume of active records divided by the record type. The File Type is the document's extension (png, jpg, gif). The seven most common File Types are displayed in the pie chart, with File Types not a part of these seven categorized under "Other."
The doughnut chart has three possible views: item count, percentage, or volume by the record's type. Select # for item count, % for percentage, or TB for volume to switch between these.
5. Records by Content Type
Rather than classifying records based on their extension, we can also organize them based on the content they contain. 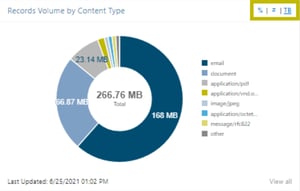
The Records by Content Type dashboard card displays the item count or item count percentage of active records by the source system's content type (if available). If the content type is not available, it classifies using the record's mime type. Alternate this view between percentage, count, and volume by selecting %, #, or TB from the highlighted section below.
6. Records over Time
With the Record versus Non-Record dashboard card, we can see the breakup of documents preserved as active records. With the Record Count over Time dashboard card, we can see how this changes over time. The two curves in the screenshot below represent the total item count in Collabspace and the total number of active records.
This card helps view a timeline of the amount of content preserved compared to all content in your Collabspace. The more content preserved, the more effectively Collabspace is being used to identify essential records.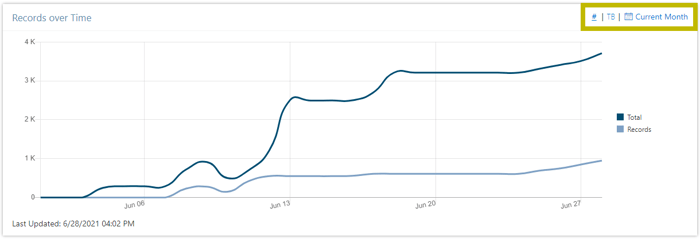
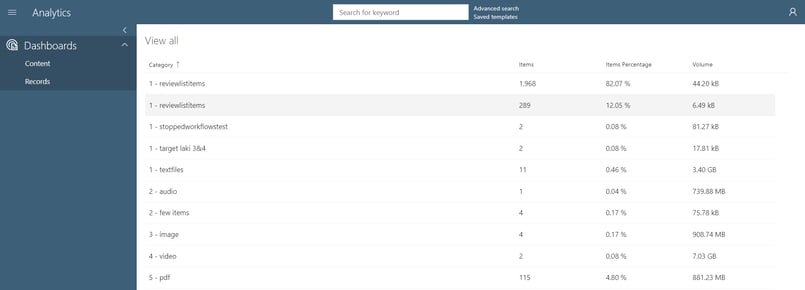
For a complete view of all data sorted by a card's metadata property, a user can click the "View All" button in the bottom right of cards. For example, clicking "View All" on the Items by Record Category dashboard card will provide a table view containing all record categories in the organization, including ones labelled as "Other" in the chart.
Conclusion
Whether checking if records are categorized for compliance purposes or checking the Records over Time chart to ensure there are no discrepancies in your organization's RM program, records analytics features bring you the data you need on your records in a single glance, from a single place. Want to learn more? We've got articles on the value of data analytics, and how to implement content enrichment in the free webinar accessible below!

Still got questions? Our team is happy to help, contact us!

*Note that records analytics features are currently in private preview, so the screenshot below is unavailable to current customers. However, if you would like to see these features for your business, reach out to kthompson@collabware.com.